
AI Chatbots vs AI Assistants vs AI Agents
Conversational AI chatbots, AI assistants, and AI agents are often used interchangeably as if they...
Unleash the expert data visualization services




















In this data driven world, businesses are inundated with an ever-increasing volume of information. This data, however, often remains untapped, locked away in silos and lacking the clarity and insights that can drive informed decision-making and business growth. This is where data visualization steps in, transforming raw data into compelling narratives that reveal hidden patterns, trends, and insights.
Expert data visualization services can help organizations overcome the challenges of data visualization by providing expertise in data cleansing and preparation, data transformation, visual design, interactive storytelling, and tool selection and implementation. By partnering with expert data visualization services, organizations can gain enhanced data understanding, make informed decisions, improve communication, increase agility, and gain a competitive advantage. Embracing data-driven insights through expert data visualization services can empower organizations to transform their data into actionable insights, driving informed decision-making, enhancing operational efficiency, and propelling business growth.
In today’s data-driven world, the ability to effectively visualize and analyze data is paramount for businesses seeking to make informed decisions, drive growth, and gain a competitive edge. Data visualization tools have emerged as powerful allies in this endeavor, transforming raw data into compelling narratives that reveal hidden patterns, trends, and insights.
Among the plethora of data visualization tools available, four stand out as industry leaders: Power BI, Tableau, Amazon Quick Sight, and Google Data Studio. Each tool offers a unique set of features, capabilities, and pricing models, catering to diverse user needs and organizational requirements.
The choice of the most suitable data visualization tool depends on various factors, including organizational needs, technical expertise, budget constraints, and existing data infrastructure. Power BI excels in integrating with Microsoft products and its ease of use, while Tableau shines with its exceptional data visualization capabilities and storytelling features. Amazon Quick Sight stands out for its integration with AWS services and cloud-native architecture, while Google Data Studio appeals with its freemium model and ease of use.
Data visualization tools play a crucial role in unlocking the power of data, enabling businesses to make informed decisions, drive growth, and gain a competitive edge. By carefully evaluating available options and selecting the right tool for their specific needs, businesses can transform data into compelling narratives that drive success.
OUR EXPERTISE

Reports and dashboards development is an essential service for businesses of all sizes. We identify the target audience for the report or dashboard. Consider their level of data literacy, decision-making roles, and preferred information formats. Clean, transform, and organize the data to make it suitable for analysis and visualization. This may involve handling missing values, identifying outliers, and creating calculated fields. Employ appropriate chart types based on the nature of the data and the desired insights. Consider bar charts, line charts, pie charts, scatter plots, and maps. Craft a compelling narrative through the arrangement of visualizations and supporting text. Highlight key findings, trends, and patterns in a clear and concise manner

We choose the most appropriate chart type for the data and desired message, ensuring clear and consistent labeling, employing well-chosen color palettes for visual appeal and data distinction, incorporating annotations for context and explanation, and implementing interactive elements, such as filters and drill-downs, to enable deeper data exploration and pattern recognition. By embracing these principles, we are able to transform data into actionable insights that fuel strategic growth and innovation

Our comprehensive data management services empower organizations to harness the power of their data for informed decision-making and business growth. We seamlessly develop, manage, prepare, transform, and deliver data flows to enable analytics at scale. Our expertise in data cleansing and data quality ensures the integrity and reliability of your data, while our API integration capabilities connect disparate data sources, fostering a unified data landscape. Our data transformation services tailor your data to align with specific analytical needs, enabling seamless integration with data visualization and analytics platforms

Our company provides data management services that help organizations harness the power of their data to create impactful data visualizations. By ensuring data accuracy, consistency, and accessibility, we lay the foundation for compelling visualizations that effectively communicate insights and drive informed decision-making. Our services encompass data cleansing, transformation, integration, warehousing, governance, and metadata management, ensuring data is ready to be transformed into meaningful visualizations. With our comprehensive approach, organizations can unlock the value of their data and create visualizations that drive business success

Our team of experienced analysts employs cutting-edge analytical techniques and data visualization tools to uncover hidden patterns, identify new opportunities, and gain a competitive edge. We collaborate closely with our clients to understand their unique business challenges and objectives, ensuring that our data-driven solutions align with their specific needs and goals

We proactively monitor and optimize the performance of the data visualization ecosystem. By continuously tracking key performance indicators (KPIs), such as visualization render time, data retrieval speed, and user interaction latency, we identify potential issues before they escalate and impact visualization creation and delivery
Schedule a consultation with our expert team to explore tailored solutions.
Talk to Experts →SOLUTIONS
Delivering excellence through digital transformation and smart automation.
TECHNOLOGY STACK
INDUSTRIES
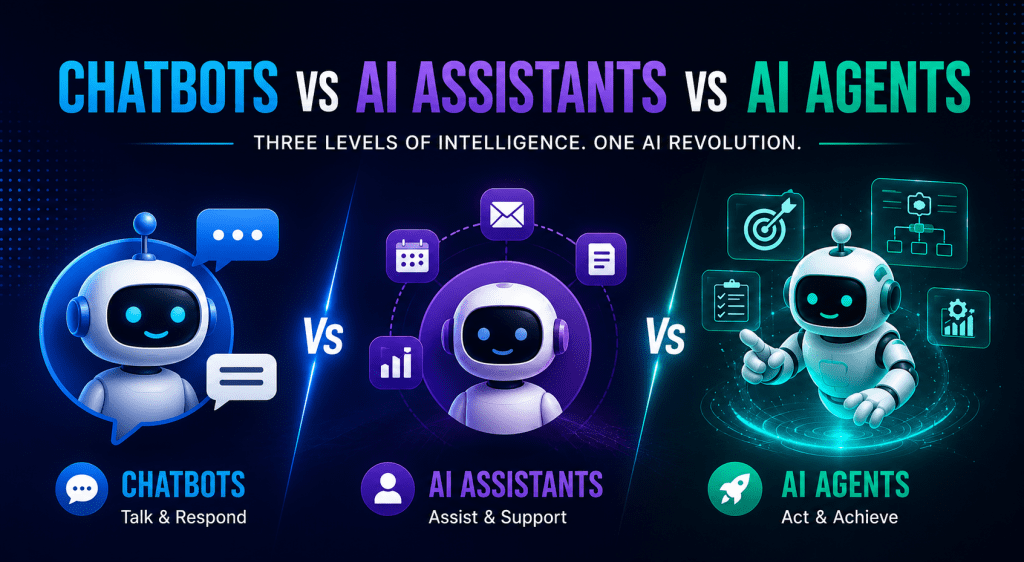
Conversational AI chatbots, AI assistants, and AI agents are often used interchangeably as if they...
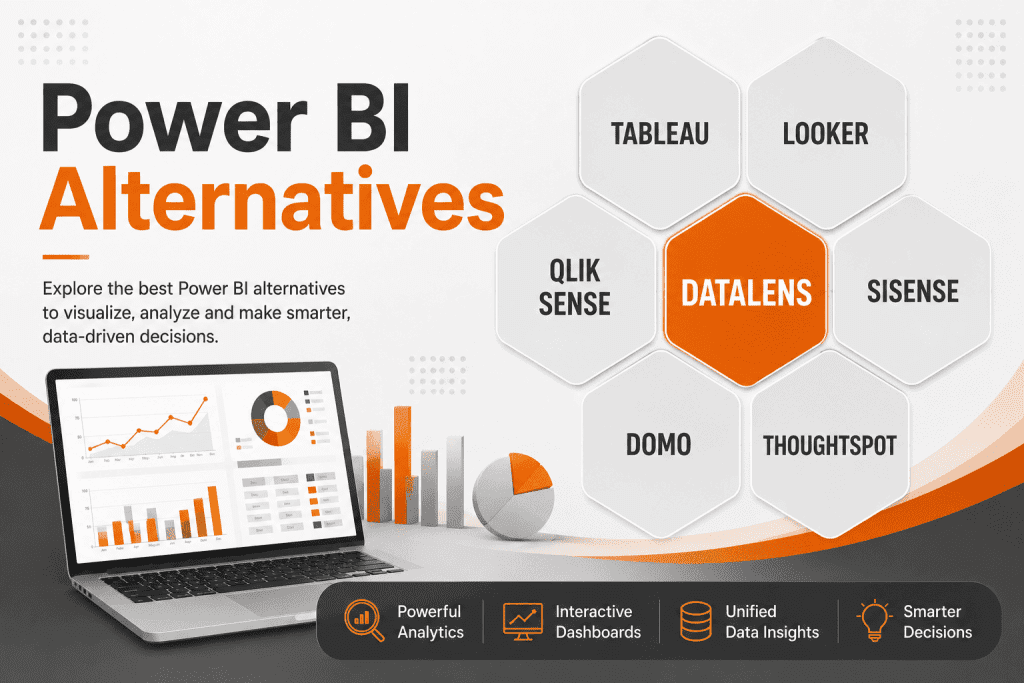
Power BI is one of the most prominent business intelligence & data visualization tools in...

How audiences consume content has changed dramatically. Traditional TV, with its set schedules and limited...
WHY CHOOSE US
SOC2 compliant with end-to-end encryption for all your data.
Go from concept to live dashboard in weeks, not months.
A full team of data engineers and designers assigned to your project.
Visualizations that are as beautiful as they are functional.
Round-the-clock support to keep your systems running smoothly.
Built to handle millions of data points without breaking a sweat.
FAQ
Yes. We provide ongoing monitoring, updates, and performance optimization after deployment.
Our architecture is designed to scale for millions of data points and high-volume enterprise environments.
Yes. Our dashboards and visualizations can be embedded into your SaaS platforms or internal enterprise applications.
We work across finance, healthcare, logistics, retail, manufacturing, and many other industries.
Yes. We provide onboarding sessions, documentation, and training workshops for your internal teams.
 Get in Touch
Let's discuss how our services can solve your unique challenges. Our team of experts is ready to help you succeed.


We’ll respond within 24 hours